
🪄 AI Summary
Heading 1
Heading 2
Heading 3
Heading 4
Heading 5
Heading 6
Lorem ipsum dolor sit amet, consectetur adipiscing elit, sed do eiusmod tempor incididunt ut labore et dolore magna aliqua. Ut enim ad minim veniam, quis nostrud exercitation ullamco laboris nisi ut aliquip ex ea commodo consequat. Duis aute irure dolor in reprehenderit in voluptate velit esse cillum dolore eu fugiat nulla pariatur.
Block quote
Ordered list
- Item 1
- Item 2
- Item 3
Unordered list
- Item A
- Item B
- Item C
Bold text
Emphasis
Superscript
Subscript
Most B2B teams measure video performance the wrong way. They watch view counts climb and call it a win. Meanwhile, the CFO wants to know what video contributed to last quarter's closed-won deals. This guide breaks down the B2B video KPIs that connect content to revenue, which metrics separate signal from noise, how to build a reporting stack that earns budget approval, and what demand generation and sales teams should each be tracking.
TL;DR
- Watch time and completion rate reveal buyer intent far better than raw views.
- Pipeline-influenced revenue and video-sourced MQLs are the B2B video KPIs that earn executive sign-off.
- Vanity metrics (impressions, likes) don't move the pipeline. Behavioral metrics tied to your CRM do.
- Tools like Wistia, Vidyard, and HubSpot are essential for connecting video engagement to revenue attribution.
What Are the Most Important B2B Video KPIs to Track?
Not all metrics are created equal. The most important B2B video KPIs split cleanly into two tiers: engagement depth metrics that reveal buyer behavior, and revenue-linked metrics that prove business impact. You need both.
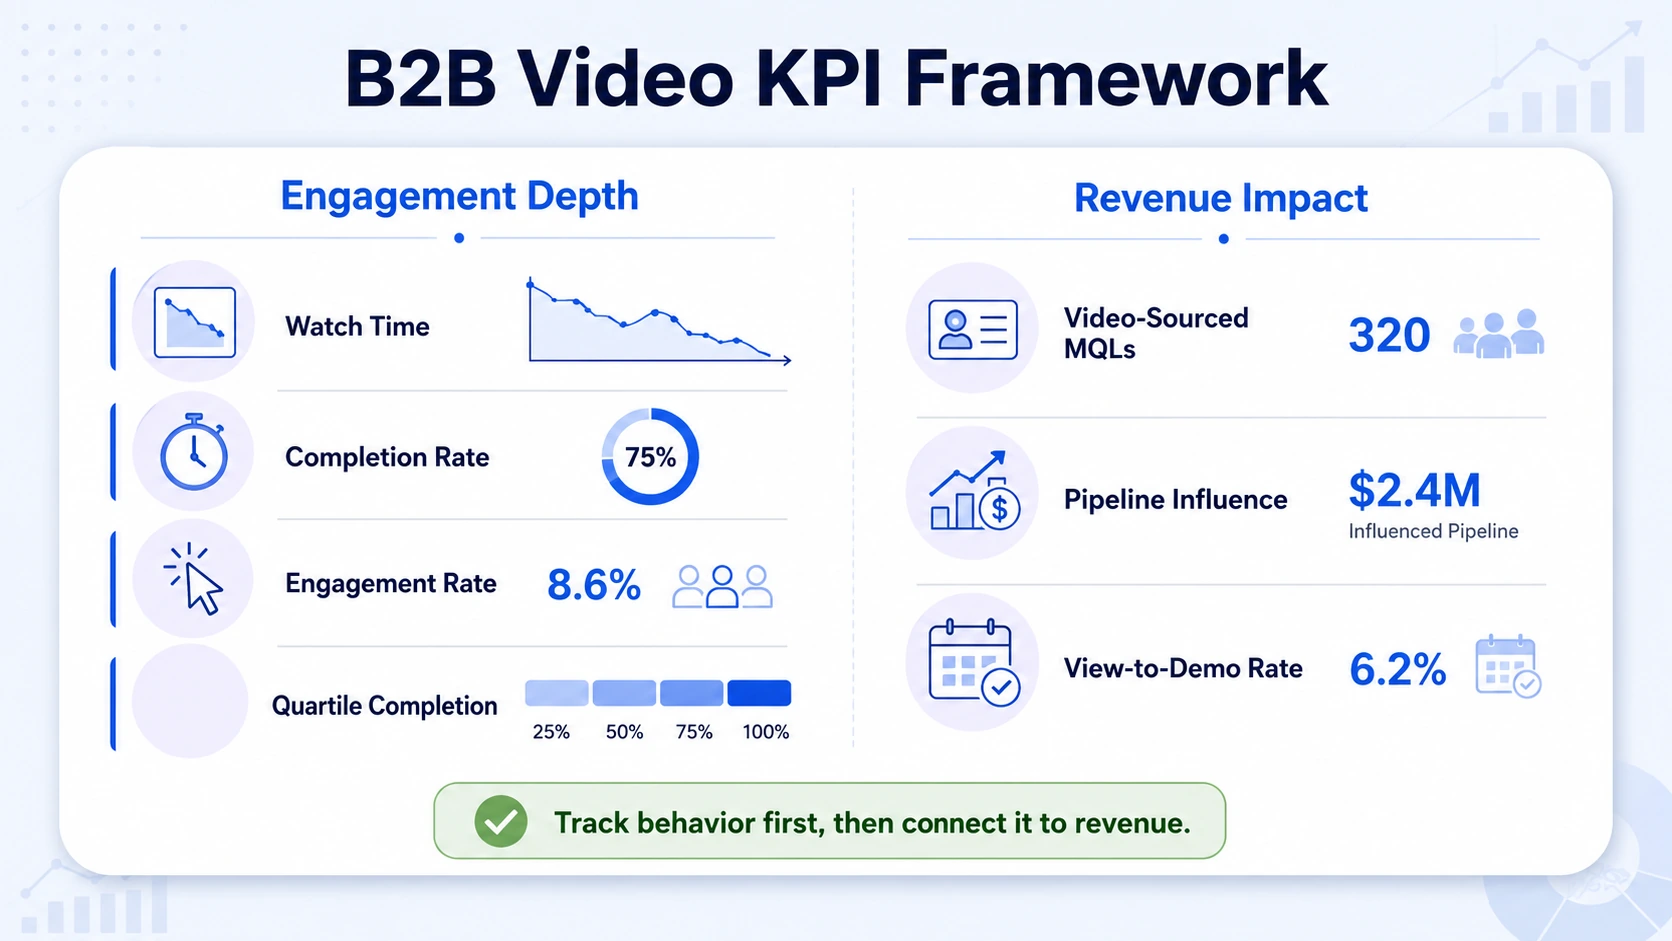
Engagement depth metrics:
- Watch time: Total minutes consumed across your video library. Aggregate watch time shows content resonance across your audience at scale.
- Video completion rate: The percentage of viewers who watch to the end. Videos under one minute achieve a 65% completion rate among B2B viewers, while videos over 20 minutes drop to 20%, according to Vidyard's benchmark report based on nearly one million B2B videos. Use this as your baseline.
- Video engagement rate: The share of viewers who interact with a video (click a CTA, replay a section, or share). This goes beyond passive viewing to active interest.
- Quartile completion (25%, 50%, 75%, 100%): Most platforms report retention at these specific milestones to help you understand where in the content lifecycle you lose viewers.
Revenue-linked metrics:
- Video-sourced MQLs: Leads who first engaged your brand through a video asset.
- Video-influenced pipeline: Opportunities where video appeared at any point in the buyer journey.
- View-to-demo conversion rate: This measures how many viewers of a specific video become a Marketing Qualified Lead. A good benchmark for a targeted campaign is a 5–10% conversion rate from a gated video asset.
How B2B Marketers Measure Video Performance in 2026
The measurement stack matters as much as the metrics themselves. For advanced analytics with CRM integration, tools like Wistia (best for marketing and branding) and Vidyard (best for sales teams with HubSpot and Salesforce integration) are the go-to platforms for B2B teams.
Here is how a mature B2B measurement workflow looks in 2026:
- Host video on a B2B platform (Wistia or Vidyard): Native analytics give you watch time, heatmaps, and viewer-level data that YouTube does not provide for lead identification.
- Connect video data to your CRM (HubSpot or Salesforce): Sync first-party engagement to the CRM. Push watch depth, re-watch events, and chapter skips straight into HubSpot or Salesforce, then score them alongside emails and calls.
- Apply video lead scoring: Assign point values based on percentage watched. A contact who watches 75% of a product demo should score higher than one who clicked play and bounced at 10%.
- Tag video assets by funnel stage: Pre-tag every video as Awareness, Pipeline Acceleration, or Deal Expansion so reporting begins with purpose, not vanity.
- Set up multi-touch attribution: Implement multi-touch attribution models that track video engagement throughout the buyer journey, and use marketing automation platforms to connect video views with lead scoring and opportunity creation.
- Report pipeline impact: Pull a monthly report showing video-influenced opportunities opened and closed-won deals where video appeared in the journey.
According to Wistia's State of Video report, LinkedIn is now B2B's number one video channel, with 8 in 10 teams saying it is their primary place to share videos. Any measurement framework in 2026 needs to account for LinkedIn Video natively, not just hosted assets on your site.
What Video KPIs Actually Matter for Pipeline Generation?
Pipeline generation is where most B2B video KPIs frameworks fall apart. Teams report on views because views are easy. Pipeline contribution requires connecting video hosting platforms to CRM data, which takes deliberate setup. The payoff is substantial: video influences over 40% of the sales pipeline on average for B2B companies, according to Demand Gen Report data.
The B2B video KPIs that pipeline and demand generation teams should prioritize:
- Video-influenced pipeline value: Dollar value of open and closed opportunities where a prospect engaged with video before or during the sales cycle. This is the headline metric for any pipeline conversation.
- Sales pipeline velocity: Does video consumption at specific funnel stages accelerate deal speed? Measure average days-to-close for video-engaged versus non-video-engaged accounts.
- Account-level video engagement (for ABM): In account-based marketing, the unit of measurement is the account, not the individual lead. Many organizations are shifting to account-centric KPIs, focusing on target accounts engaged, account win rates, and pipeline per account, rather than lead volume. Track which named accounts are watching which videos and for how long.
- Demo request rate post-video: The strongest pipeline predictors include high video completion rates and above-average click-through rates. Form completion rates from video landing pages and demo request rates post-video viewing strongly indicate purchase intent.
- Intent signal lift: Pair video engagement data with intent data platforms like Bombora to see whether accounts consuming your video content show rising purchase intent signals, a reliable early warning for pipeline creation.
Executives don't care that your explainer video hit 25,000 plays. They care that three enterprise prospects booked demos after watching. Pipeline contribution is the only video KPI that survives a board review.
Vanity Metrics vs. Meaningful B2B Video KPIs: Know the Difference
This is the conversation every B2B marketing head needs to have with their team. An MQL alone, a single hand-raise like a webinar sign-up or whitepaper download, is often considered a vanity metric by modern marketing leaders. The same logic applies to video.
Vanity metrics (measure with caution):
- Raw view count (inflated by auto-play, bot traffic, and casual scrollers)
- Impressions (exposure, not engagement)
- Subscriber or follower growth
- Social likes and shares in isolation
Meaningful B2B video KPIs (tie to revenue outcomes):
- Completion rate by video type and funnel stage
- Video engagement rate on LinkedIn Video for named accounts
- Watch time per session (indicates depth of interest)
- Track view count, watch time, average view duration, and audience retention rate for engagement depth, then layer on click-through rates, form completions, and content downloads for action metrics.
- Marketing qualified leads sourced directly from video
The clearest test: can you draw a line from this metric to a closed-won deal? If the answer requires three layers of assumption, it is a vanity metric. If your video hosting platform shows that a contact watched 80% of a product demo and then booked a discovery call the next day, that is a meaningful signal. Leading organizations complement engagement metrics with downstream business metrics like pipeline influence and revenue attribution for complete performance visibility.
Platforms like Vidyard and Wistia make this possible by surfacing viewer-level data. Native social analytics (LinkedIn Video, YouTube) do not. That gap in data quality is precisely why video hosting platforms are non-negotiable for B2B teams serious about video marketing ROI.
How to Measure ROI on B2B Video Content
Content ROI is the hardest question in B2B marketing, and video ROI is no exception. The good news: 82% of video marketers say video has delivered a good return on investment, according to Wyzowl's 2026 report , so the category performs. The question is whether your specific video program can prove it.
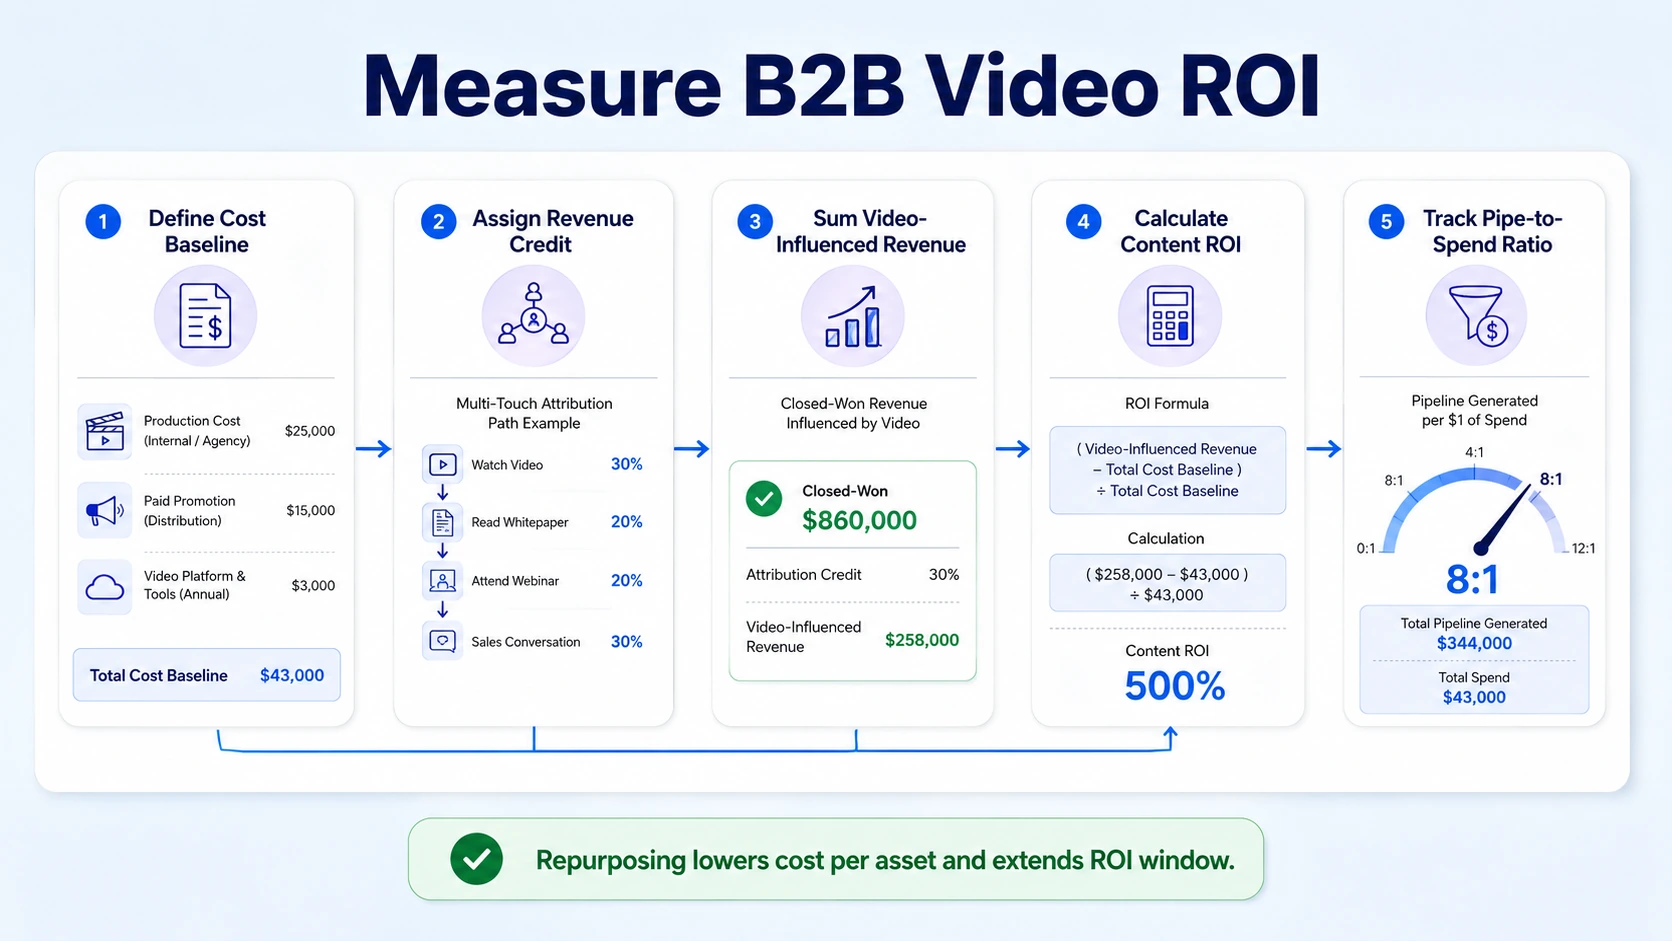
Here is a practical ROI measurement framework for B2B video:
- Define your cost baseline: Include production (internal time or agency fees), distribution (paid promotion on LinkedIn), and platform costs (Wistia, Vidyard subscriptions).
- Assign revenue credit via multi-touch attribution: Use HubSpot's attribution reporting or a revenue attribution layer to assign partial credit to video touchpoints across the buyer journey.
- Calculate video-influenced revenue: Sum the closed-won value of deals where video appeared in the journey. This is your numerator.
- Compute content ROI: (Video-influenced revenue minus total video investment) divided by total video investment, expressed as a percentage.
- Track pipe-to-spend ratio by video type: This KPI is measured by taking pipeline created from a program and dividing it by the total investment. A strong benchmark across demand gen channels is an 8:1 ratio. Apply the same discipline to video.
For teams repurposing long-form content, such as webinars, podcasts, and demos, into short-form video clips, the ROI math improves significantly because production cost per asset drops while distribution reach expands. Our short-form video editing services are specifically built around this model. On-demand webinars keep getting plays for up to 12 months after the live event , which means the ROI window on a repurposed webinar clip is longer than most teams realize.
B2B Video Analytics Best Practices for Sales and Marketing Teams
The final layer of any solid B2B video KPIs framework is who owns what and how the data flows between marketing and sales.
For demand generation and marketing teams:
- Set video-specific MQL thresholds in your lead scoring model (e.g., 75% watch completion on a product demo = MQL trigger).
- Leverage CRM platforms like HubSpot, marketing automation like Marketo, and analytics tools to collect, segment, and visualize your data.
- Monitor LinkedIn Video watch time quarterly. LinkedIn video watch time grew 36% year over year , making it the highest-growth distribution channel for B2B content.
For sales teams:
- Use Vidyard's sales video analytics to see which prospects re-watched specific sections of a demo, a reliable signal of objection or high interest.
- Track video opens in sales sequences the same way you track email opens: as a leading indicator of deal progression.
- Share account-level video engagement data in deal reviews to inform which topics resonate with each buying committee.
Shared reporting cadence (recommended):
93% of video marketers say video has helped increase user understanding of their product or service, according to Wyzowl 2026 , but understanding alone does not close deals. The only way to know whether your video program is working is to connect viewer behavior to pipeline outcomes at every stage through integrated video editing services and analytics tools working in concert.
For teams building this from scratch or auditing an existing setup, our services page covers the full video production and strategy stack we use with B2B clients.
Conclusion
B2B video KPIs only create value when they connect viewer behavior to revenue outcomes. Here are the core takeaways:
- Replace vanity metrics (views, impressions) with behavioral metrics (completion rate, watch time, view-to-demo rate) tied to your CRM.
- Pipeline influence and revenue attribution are the two metrics that earn budget approval and board-level respect.
- Integrate Wistia or Vidyard with HubSpot or Salesforce to get viewer-level data that native social platforms cannot provide.
- Align marketing and sales around a shared video reporting cadence so video insights flow into deal reviews, not just marketing dashboards.
Frequently Asked Questions
Q1: What is a good video completion rate benchmark for B2B content?
Videos under one minute achieve a 65% completion rate among B2B viewers. For hosted product demos or webinar clips, aim for 50%+ completion as a meaningful engagement threshold. Anything below 30% on a short-form asset signals a hook or relevance problem.
Q2: How do I connect video analytics to HubSpot or Salesforce?
Use Vidyard or Wistia's native CRM integrations. Both platforms push viewer-level data (contact email, watch percentage, re-watch events) directly into contact records and allow you to trigger workflows or lead score updates based on video behavior without manual exports.
Q3: Which B2B video KPIs matter most for a sales team?
Sales teams should focus on three: individual prospect watch time on specific demo or case study videos, re-watch events (a strong signal of objection or high interest), and post-video demo request rate. These directly indicate where a prospect sits in the decision process.
Q4: What is a video-influenced pipeline and how do I calculate it?
Video-influenced pipeline is the dollar value of open or closed-won opportunities where a contact is engaged with video at any point during the buyer journey. Calculate it by filtering your CRM for deals containing at least one video touchpoint and summing their pipeline value.
Q5: Are LinkedIn Video metrics reliable for B2B measurement?
LinkedIn Video provides quartile completion data and average watch time for both organic and paid content, making it more useful than most social platforms for B2B analytics. However, it does not provide individual viewer identity for organic posts, so pair LinkedIn Video data with Wistia or Vidyard for lead-level insights.
Q6: How often should B2B teams review their video KPIs?
Video-sourced MQLs and demo requests should be reviewed weekly. Pipeline influence and closed-won video attribution should be reviewed monthly. Full content ROI by video type is a quarterly conversation, ideally timed to budget planning cycles so video investment decisions are grounded in actual performance data.